Bridging Infrastructure and AI: Robinhood's MCP-Powered Ecosystem
November 3, 2025
How the Model Context Protocol enables AI-native storage automation
Authors: Andrew Fan, Ashvin Vinodh
Robinhood was founded on a simple idea: that our financial markets should be accessible to all. With customers at the heart of our decisions, Robinhood is lowering barriers and providing greater access to financial information and investing. Together, we are building products and services that help create a financial system everyone can participate in.
Introduction
At Robinhood, ensuring safe database operations is critical. Our storage infrastructure supports real-time financial operations, powering everything from transactional systems to analytical workloads. As our number of customers and services continue to grow, so does the complexity and scale of our storage systems and with it, the cost of manual operations.
To meet this challenge, we built a unified, LLM-driven platform powered by the Model Context Protocol (MCP). The goal of this system is to provide AI-powered reasoning capabilities over real-time database performance insights and diagnostic data in the most secure and least invasive way possible. These insights are surfaced across various surfaces, right from GitHub pull requests to a Slack application/Bot.
The Problem
Robinhood's Storage team owns the reliability, safety, and performance of a vast storage footprint that spans hundreds of Postgres databases, our relational database of choice for all online data operations. We leverage Amazon Aurora, a managed-database offering for Postgres.
We deploy hundreds of microservices, each with their dedicated database clusters. With the proliferation of services, our infrastructure workflows encountered bottlenecks including:
- Fragmented tooling and on-call fatigue: debugging database issues necessitates sifting through numerous dashboards, logs, and bespoke scripts, leading to increased MTTR for alerts and incidents.
- High volumes of schema migration pull requests: requires manual reviews from the Storage team to reduce the risk of backward-incompatible database changes or long-running migrations.
- Insufficient context for PR reviewers, particularly regarding live schema or index states.
We needed an extensible platform capable of integrating infrastructure metadata with intelligent agents to deduce insights from a diverse range of signals. At the same time, we want to do this as securely as possible, removing any risk of sensitive data leaks and performance regressions.
Use Cases
Building an intelligent storage platform aimed to achieve several key objectives:
- Provide diagnostic and reasoning capabilities over a large number of storage signals, surfaced via natural language interfaces and automations.
- Minimize manual review cycles and accelerate incident triage.
- Automate schema migration reviews by leveraging best-practice runbooks and real-time database statistics.
- Make storage insights more accessible across all teams.
Key personas include:
- Storage engineers: validate migrations and debug database performance issues.
- Application engineers: write schema migrations and investigate application performance characteristics related to database access patterns.
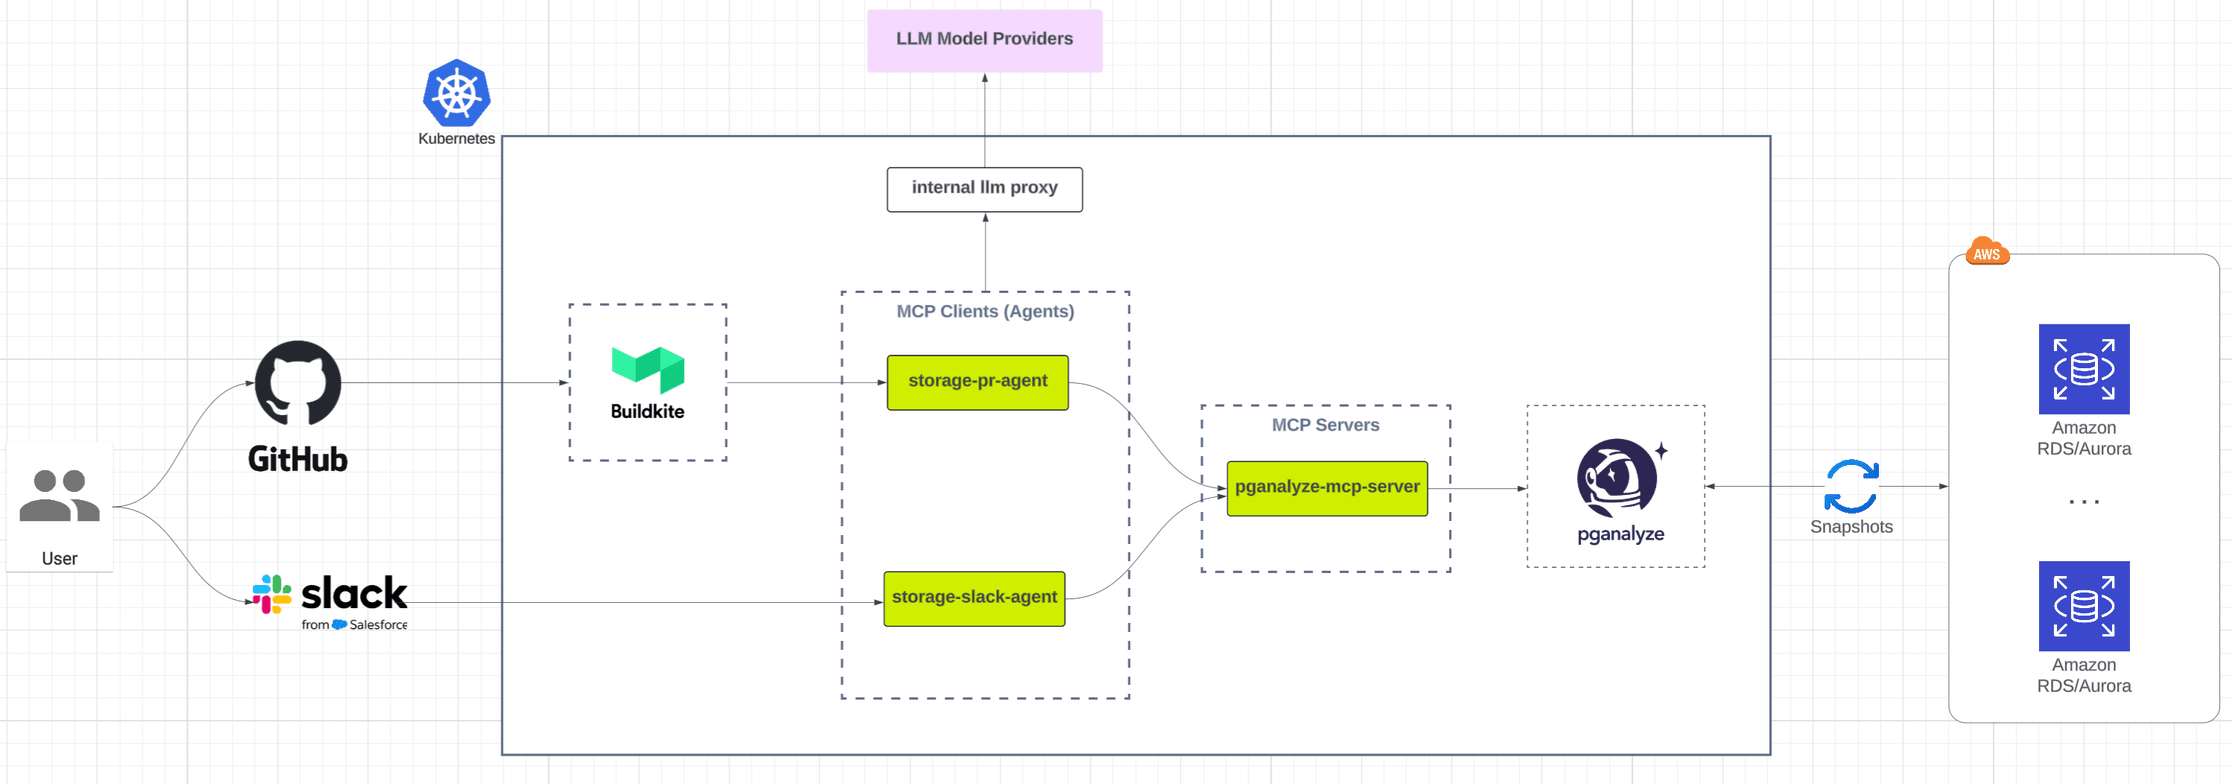
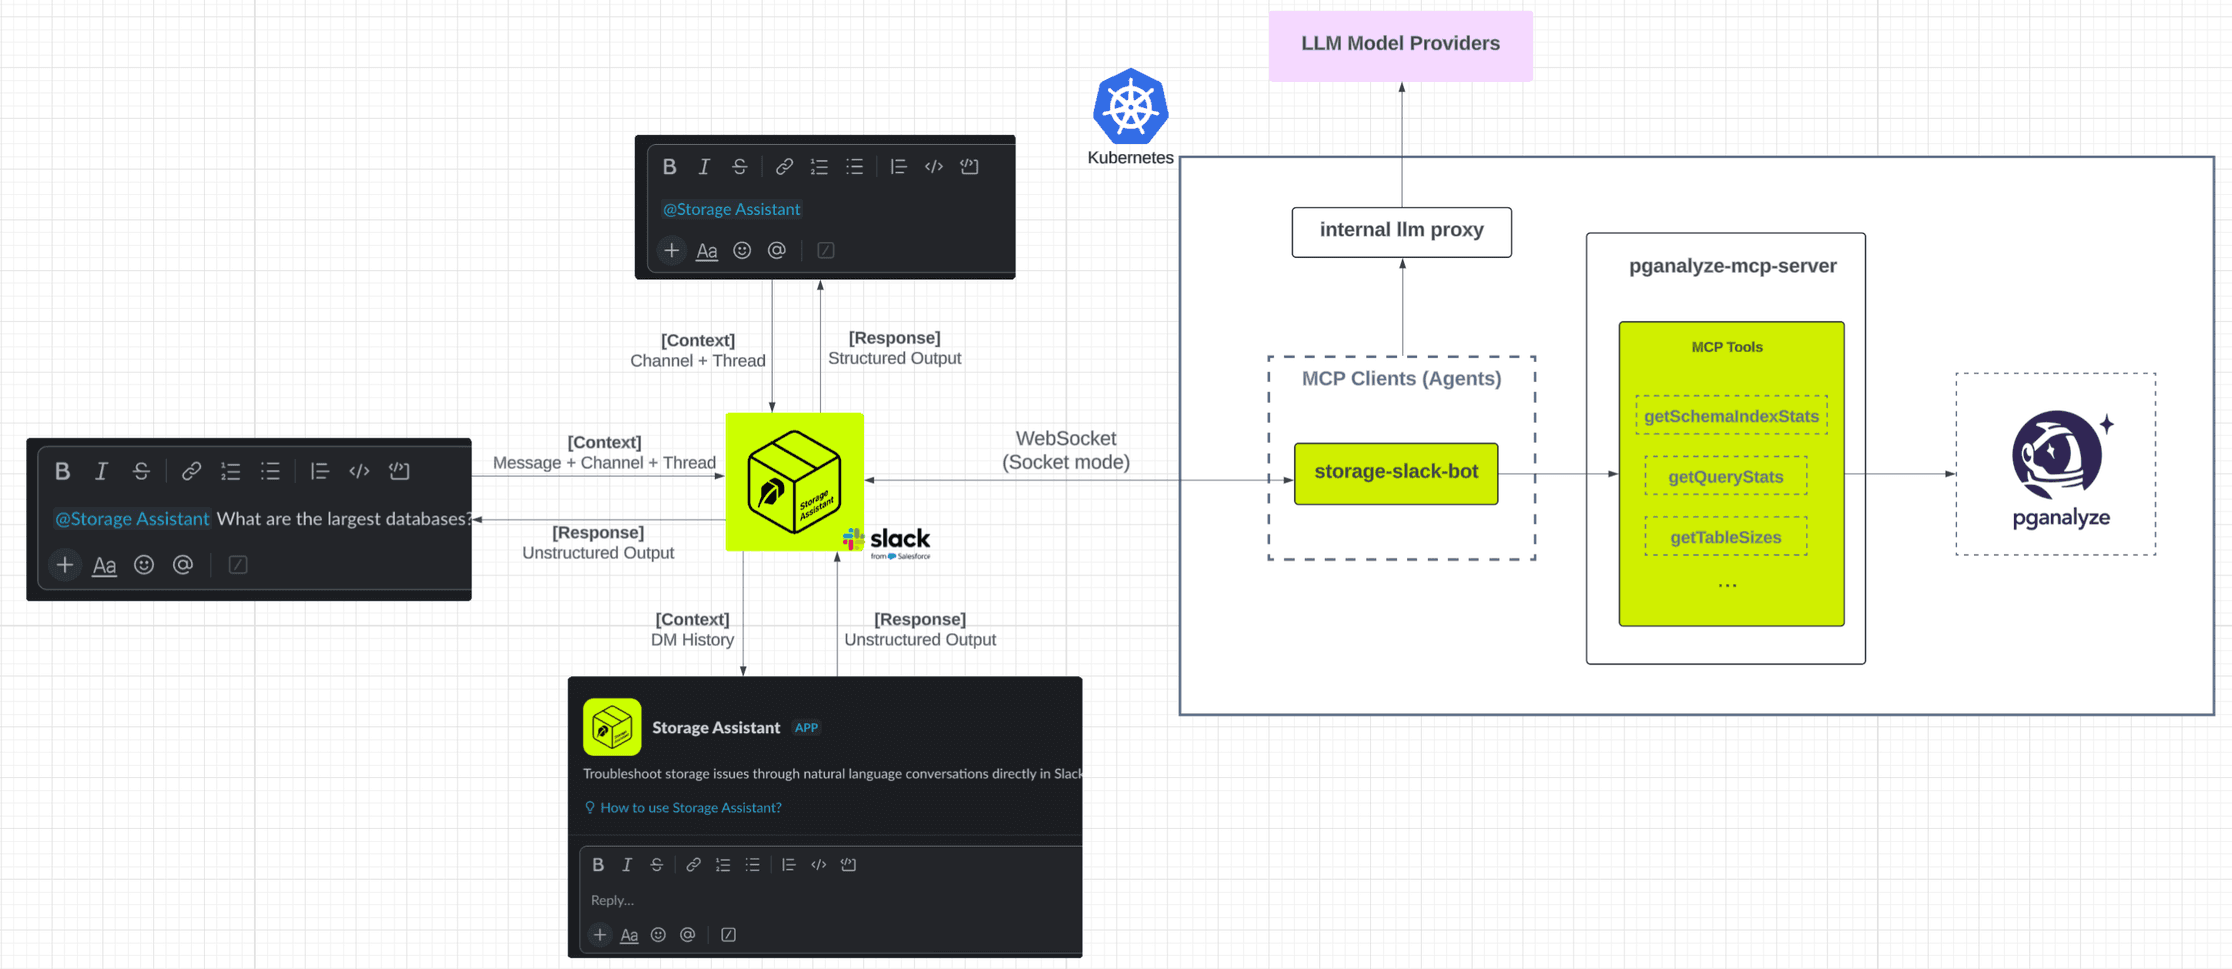
Architecture Overview
MCP (Model Context Protocol) is an open-source standard for connecting AI applications to external systems. MCP provides a standardized way to connect LLMs to data sources (for example, local files or databases) and tools, enabling them to access key contextual information.
By connecting an LLM agent with the relevant MCP server, it is able to automatically fetch the available tools from the server. Leveraging the metadata defined for each tool, the LLM identifies which tools are most relevant to respond to the current prompt and calls them sequentially.
The core principle behind our architecture is this: once tools are exposed via MCP, they become reusable, composable building blocks for any workflow. Our ecosystem builds on this abstraction to deliver consistent and structured access to storage insights.
Our system has three core layers:
- Pganalyze MCP server: surfaces diagnostics, schema, and performance tools using MCP's structured interface by leveraging Pganalyze GraphQL APIs
- Agents: LLM-powered, multi-turn, and protocol-aware applications. The custom MCP client we built underpins our GitHub PR agent and Slack assistant
- User interfaces: insights surface through familiar entry points, including GitHub PR checks via CI pipelines, Slack conversations, and third-party clients (Cursor and Claude Code)
Why Pganalyze?
There are various open-source Postgres MCP servers that expose rich tooling around surfacing database metadata as well as the ability to execute SQL directly against the database. However, they introduce several challenges:
- Risk of sensitive or user data being fetched, which requires strict controls to ensure the MCP server executes using a dedicated database user with a limited set of permissions.
- SPI/PII redaction: if the goal is to fetch user data but filter away sensitive columns, LLMs can often find creative ways to obtain similar data from other tables or columns depending on prompting.
- Performance considerations: LLMs can execute suboptimal SQL queries via the MCP server if permitted to run arbitrary SQL, or overwhelm the database with connections depending on scale.
To ensure the highest standards of safety, we instead chose to implement a custom MCP server over Pganalyze, a third-party Postgres monitoring tool that Robinhood licenses and deploys in our clusters. Pganalyze periodically collects metadata snapshots of each database in our fleet by querying system catalogs and monitoring tables. These snapshots contain information about database schema and entities, table and index statistics, and query performance stats.
Since there is no user data being exported, Pganalyze helps us remove the risk of data leaks, providing a secure data source to pull insights from. It is important to note that the relevant Pganalyze configurations must be set to enforce log and query text or parameter value filtering and masking to avoid any risk of sensitive data being exposed.
Component Deep Dive
Pganalyze MCP Server
We leverage the official MCP server Python SDK (github.com/modelcontextprotocol/python-sdk) to build a custom Pganalyze MCP server that exposes Postgres database performance insights and metadata tools by wrapping Pganalyze's native GraphQL APIs.
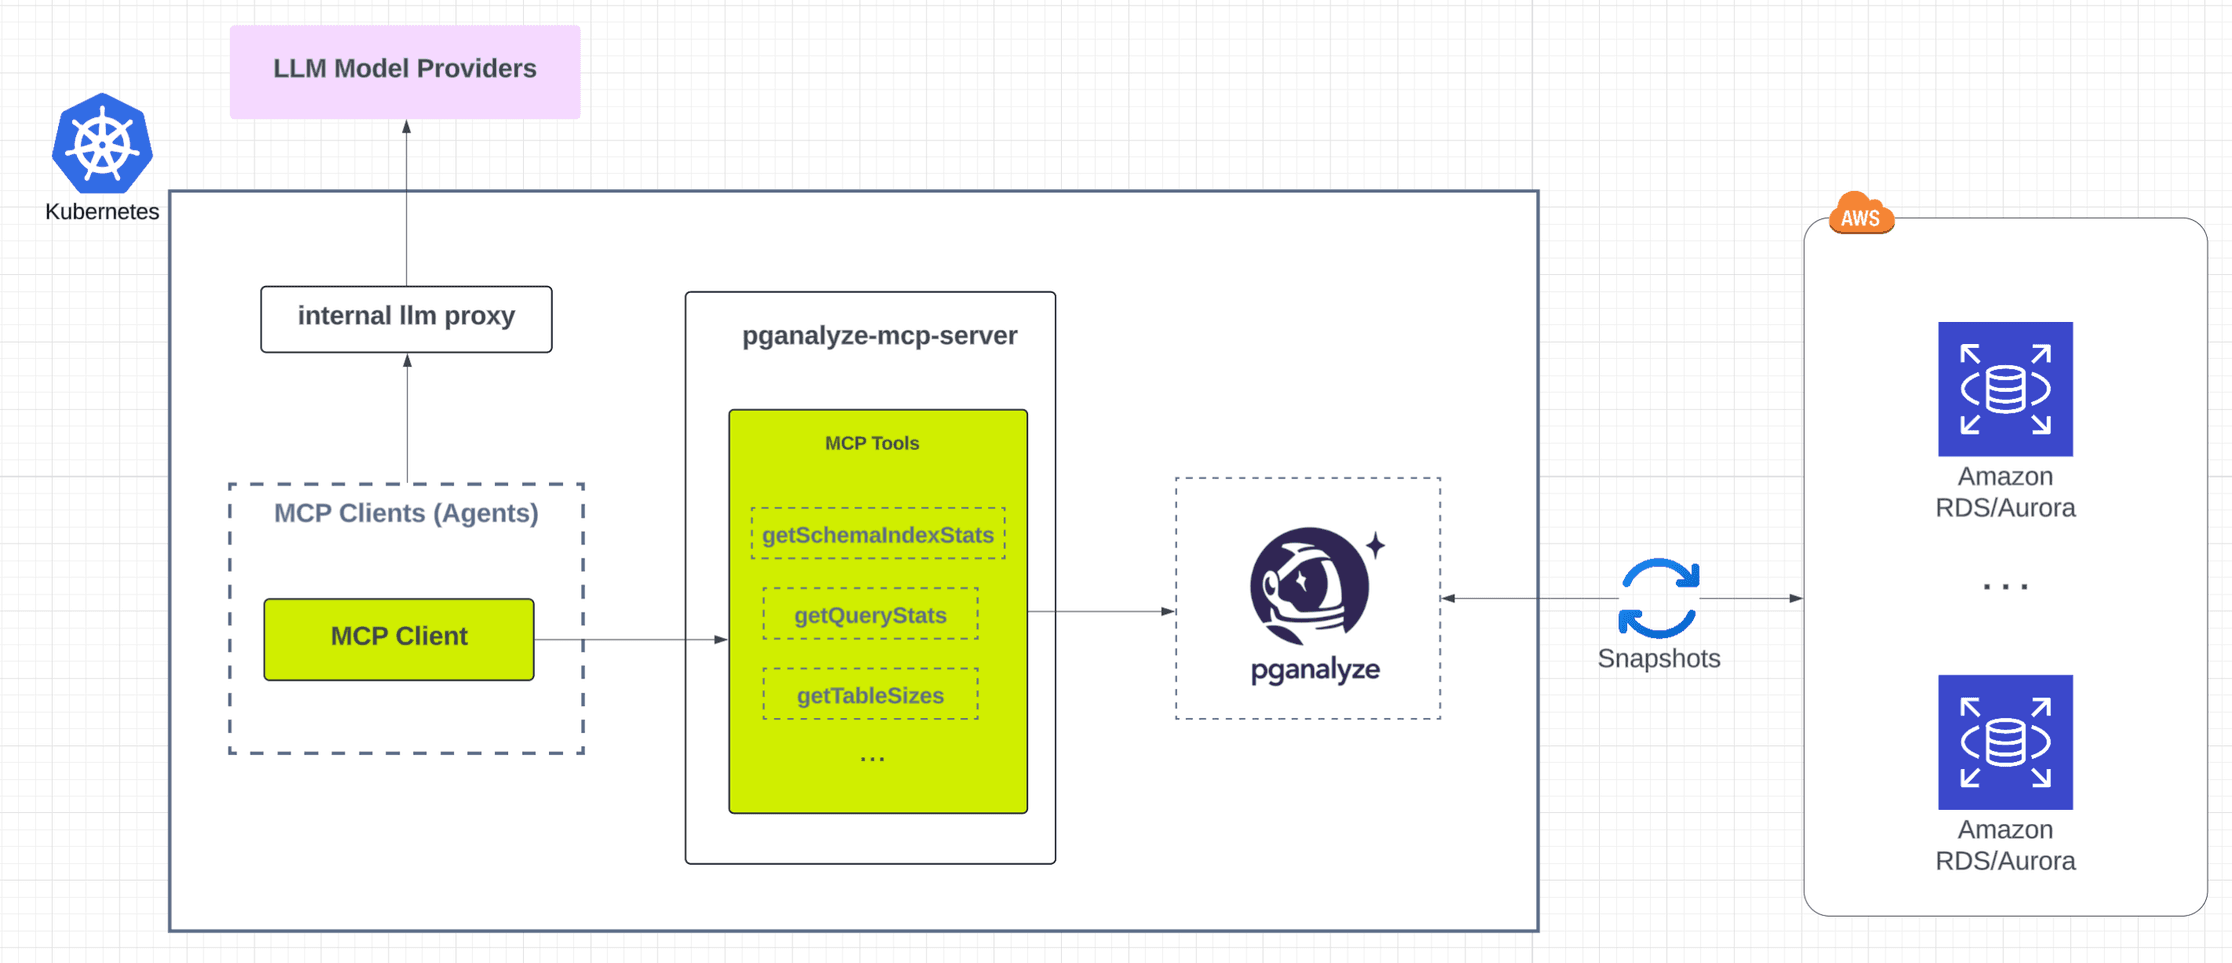
We define the Pganalyze GraphQL endpoints in a JSON file, which is then parsed to generate the relevant MCP tool definitions and GraphQL calls dynamically:
"getSchemaTableStats": {
  "description": "Deliver time-series metrics for a table (insert/update/delete rates plus table, index, TOAST and total size) over a specified period to spot bloat and growth trends. Returns arrays of [unix_ts, value] pairs that may be empty when the range has no snapshots. Note: timestamp intervals are 600 seconds apart but data is aggregated per 60 seconds.",
  "operation_type": "query",
  "query": "query getSchemaTableStats($databaseId: ID!, $schemaTableId: ID!, $startTs: Int!, $endTs: Int!) {\n  getSchemaTableStats(\n    databaseId: $databaseId\n    schemaTableId: $schemaTableId\n    startTs: $startTs\n    endTs: $endTs\n  ) {\n    __typename\n    # deletes # Type: LIST\n    # hotUpdates # Type: LIST\n    id # Type: NON_NULL\n    indexSize # Type: LIST\n    inserts # Type: LIST\n    tableSize # Type: LIST\n    # toastSize # Type: LIST\n    totalSize # Type: LIST\n    updates # Type: LIST\n  }\n}",
  "variables": {
    "databaseId": {
      "type": "string",
      "description": "GraphQL variable: $databaseId",
      "example": "0",
      "required": true
    },
    "schemaTableId": {
      "type": "string",
      "description": "GraphQL variable: $schemaTableId",
      "example": "0",
      "required": true
    },
    "startTs": {
      "type": "integer",
      "description": "GraphQL variable: $startTs",
      "example": null,
      "required": true
    },
    "endTs": {
      "type": "integer",
      "description": "GraphQL variable: $endTs",
      "example": null,
      "required": true
    }
  }
},
Key details:
- Caching & safety: all data is sourced from Pganalyze metric snapshots, not live database queries.
- Security: since Pganalyze does not access user data, there is no mechanism for the MCP server to surface sensitive information.
- Performance optimized: TTL caching is applied at the MCP tool level to reduce load during high-volume operations such as PR analysis.
- Tool coverage: more than 90 MCP tools register dynamically via JSON; new tools can be added declaratively without touching application logic.
- Extensibility: defining a new tool is as simple as adding a JSON object for the relevant endpoint, and the MCP tool is generated automatically.
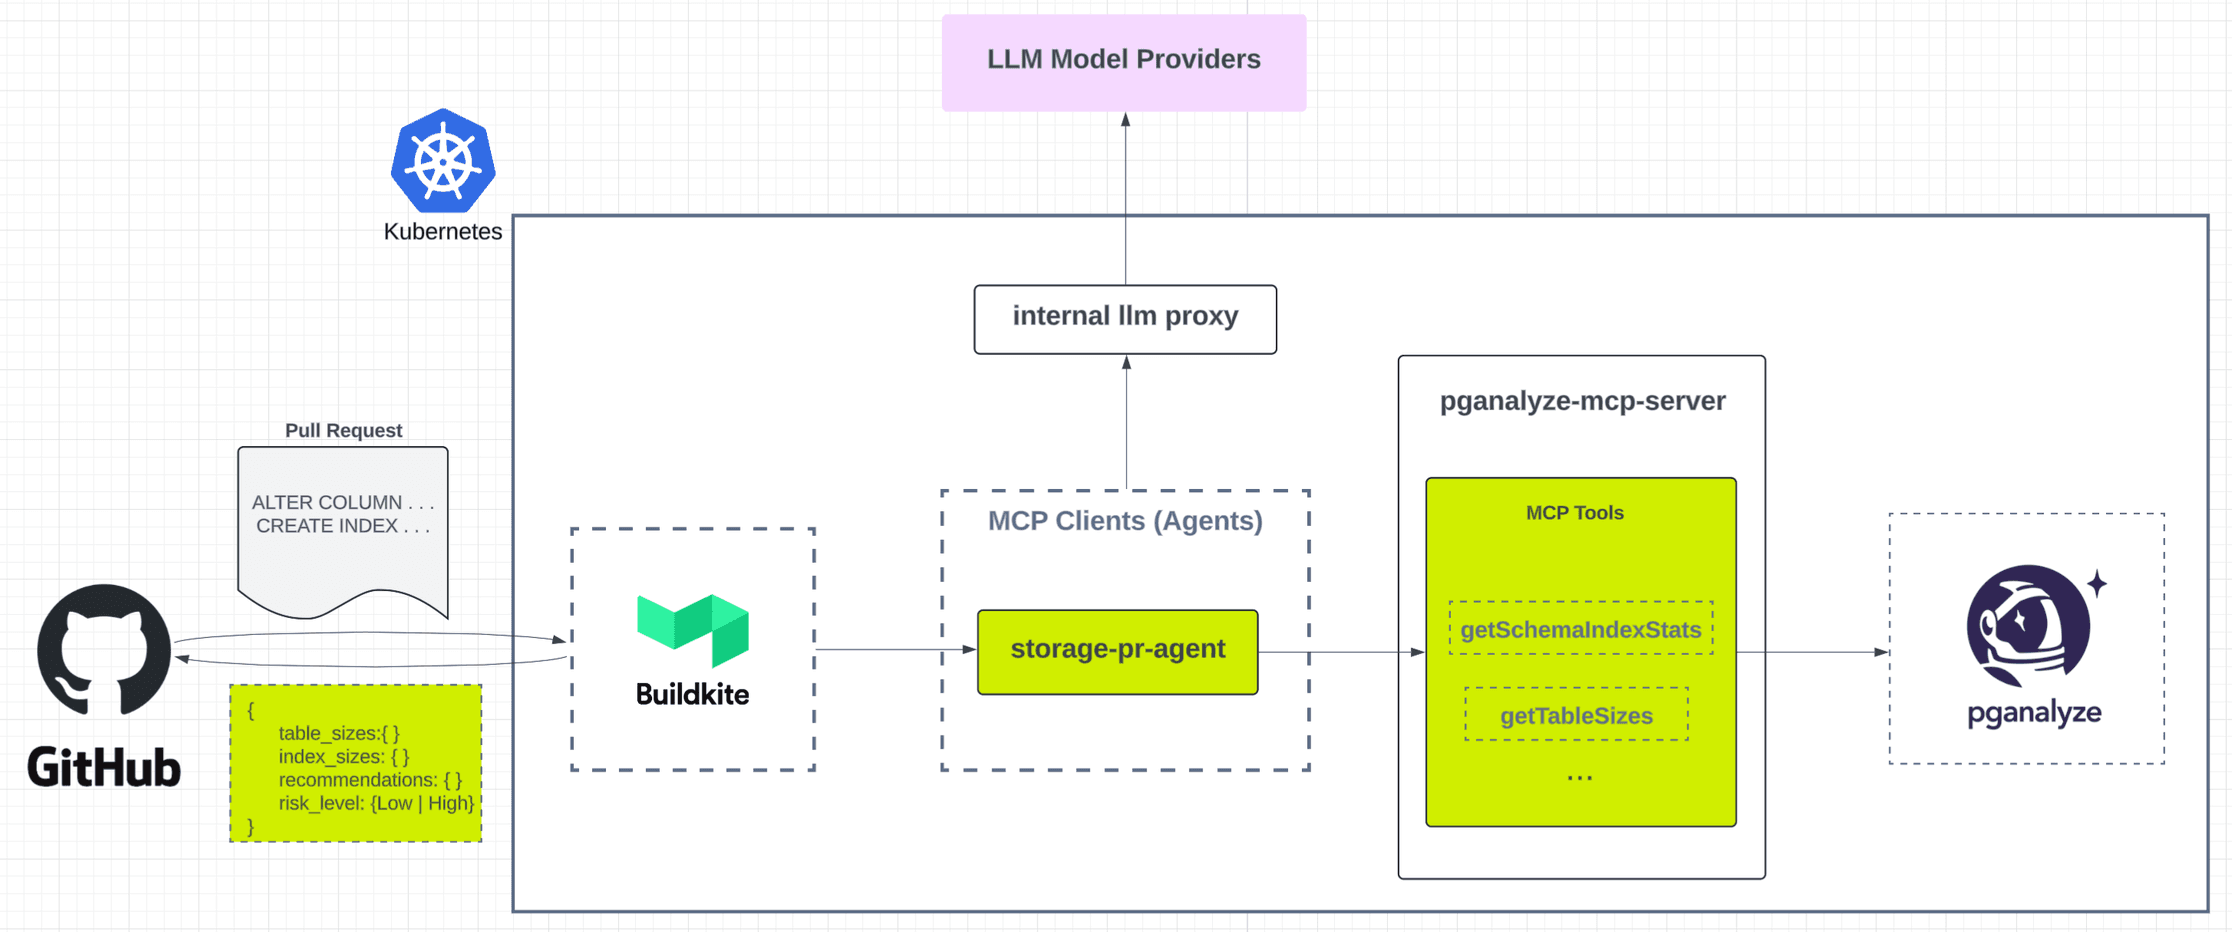
Storage PR Agent
The Storage PR agent is a multi-turn agent that performs automated reviews of schema migration GitHub pull requests. It exposes an HTTP API invoked by our Buildkite CI pipeline and serves as the first line of defense against dangerous schema migration changes.
Example schema migration:
Consider the following migration where we add a new index on a large table:
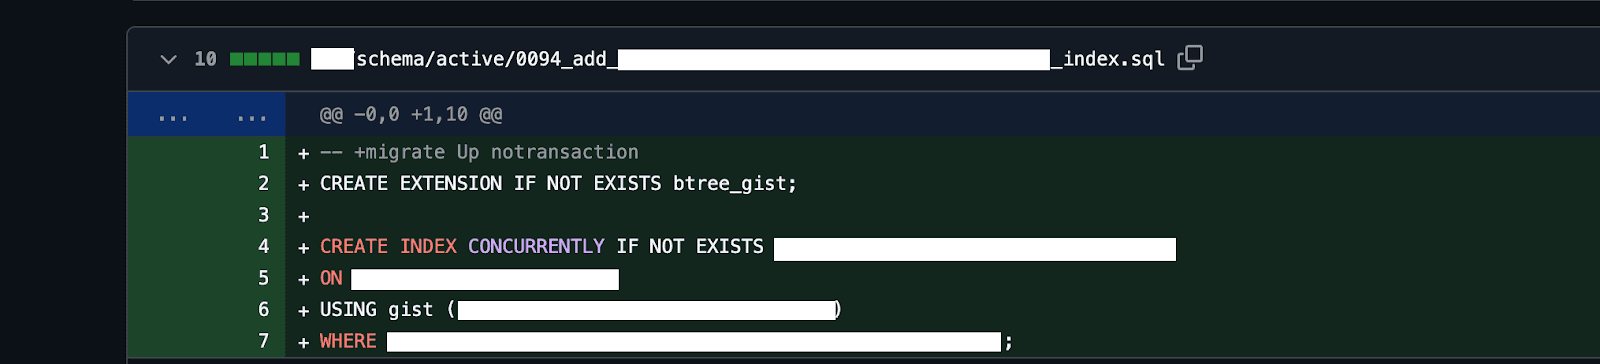
The analysis posted back to the GitHub PR explicitly calls out the size of the table and the risk of timing out application deployments if this index creation is run as part of it.
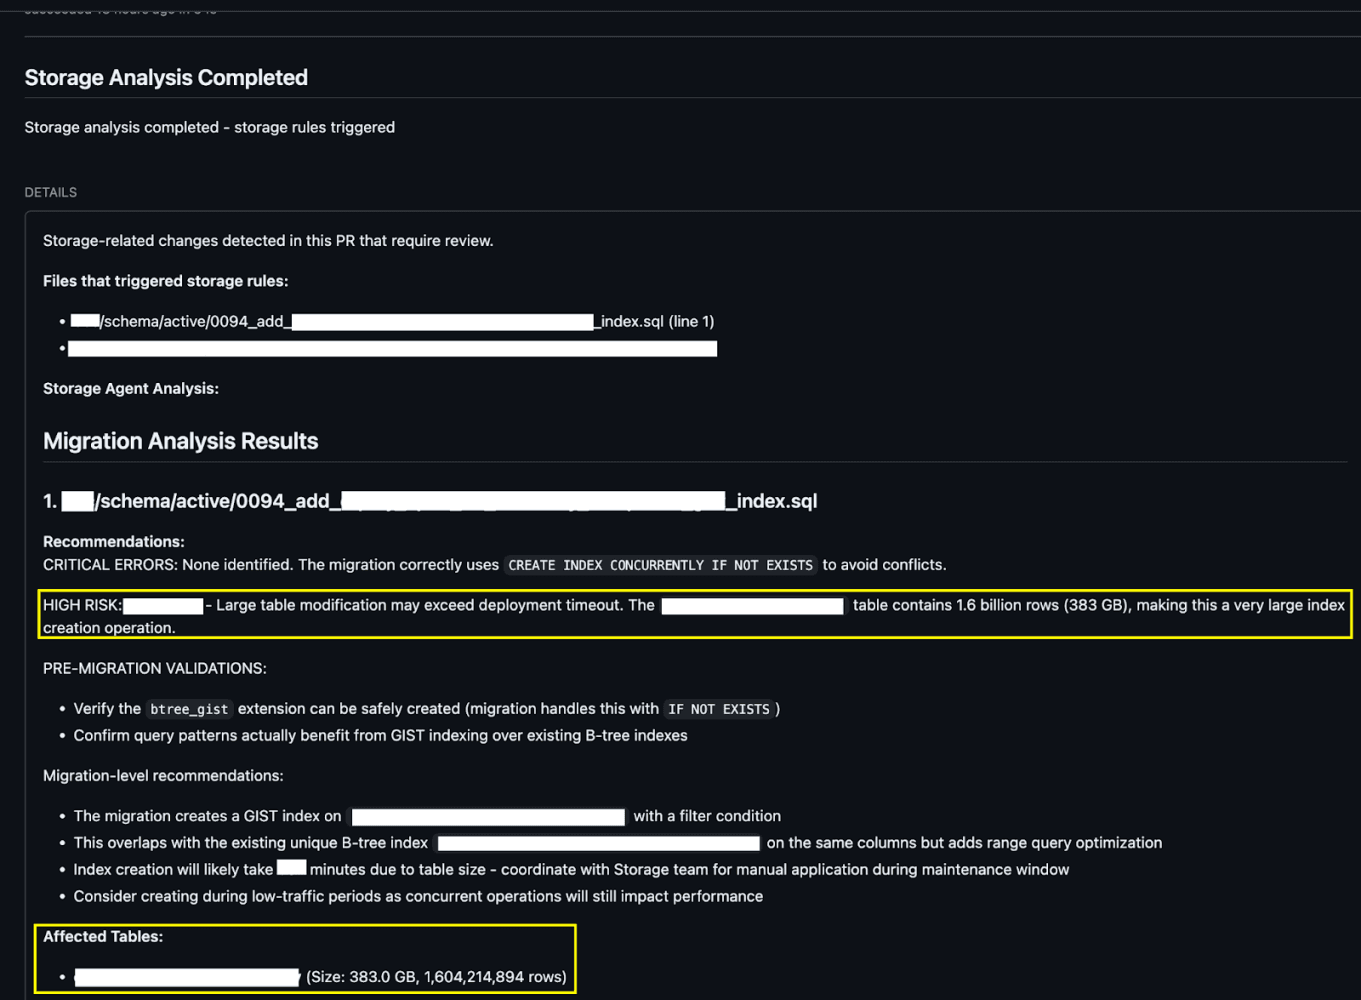
Moreover, the PR is explicitly labelled as high risk for clarity.

The above example showcases a schema migration defined as SQL, but we support a similar workflow for Django (Python-based) schema migration definitions.
Key details:
- CI integration: when Buildkite pipelines detect schema migration PRs, the agent is called with the PR contents.
- Dynamic tool orchestration: the agent pulls context from GitHub PRs and invokes MCP tools to assess table and index statistics as well as other schema characteristics.
- Framework-aware runbook selection: the system prompt uses language- and ORM-aware strategies (for example, Python/Django or Go) to enforce validation rules grounded in internal best practices.
- Agent analysis loop: the agent relies on iterative LLM reasoning.
- Risk labeling: results are posted as GitHub check runs with clear markdown summaries and labels such as
Storage: Schema Migration – High Risk.
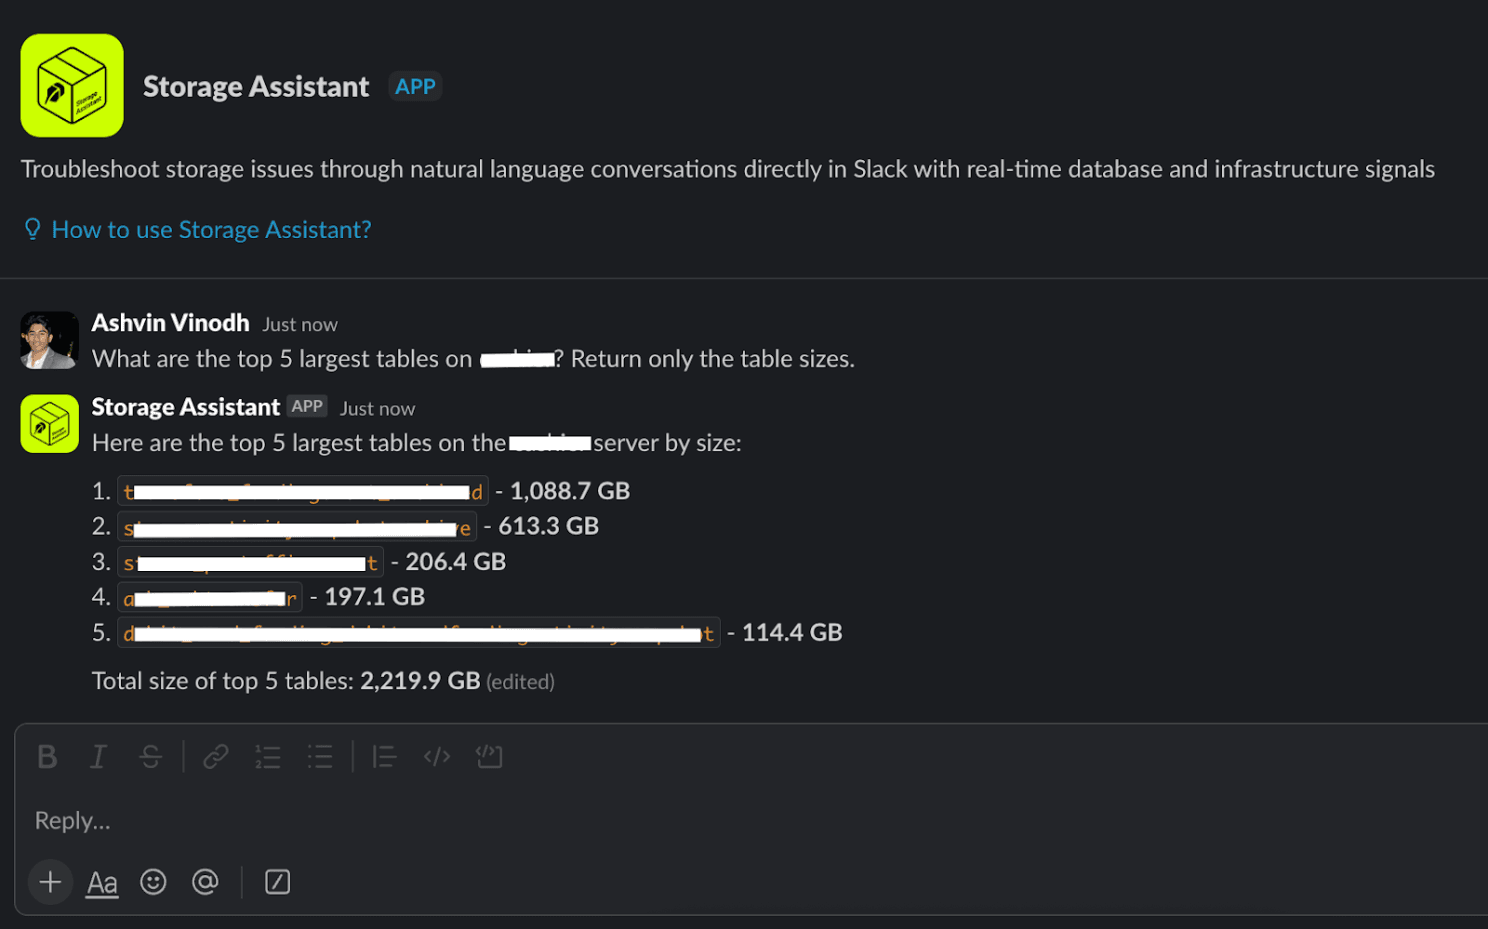
Slack Storage Assistant
The Slack assistant offers engineers a conversational interface for querying database metadata and insights without needing specialized dashboards or deep knowledge of MCP tooling.
We wanted to make this assistant available across surfaces, including DMs, threads, and channels. A custom MCP client integrates with the Slack API to gather the relevant message context, such as thread, channel, and DM history, before invoking MCP tools.
Key details:
- Shared foundation: leverages the same MCP client integration as the PR agent, enabling reuse of the full toolset in conversational workflows.
- Context modes — channel mentions: generates concise, structured summaries contextualized to the conversation thread.
- Context modes — DMs: supports multi-turn investigations with retained message history for interactive debugging.
- Context modes — empty mentions: reviews thread or channel history to surface risks or action items during incidents.
- Safe by design: only authorized Robinhood users can use the Slack app, and it fetches and analyzes metadata solely via the Pganalyze MCP server.
Impact
Since adopting this ecosystem, we've seen dramatic improvements across our workflows:
- Developer velocity: reduced operational burden on the Storage team by enabling seamless database performance analysis and automating complex diagnostics such as cross-shard schema mismatch detection.
- Schema review coverage: expanded from a handful of critical services to automated coverage across all (hundreds of) services.
- PR review latency: decreased from more than ten minutes to under two minutes for most cases.
Looking Ahead
- Expand MCP server coverage: develop additional MCP server integrations across metrics, logging, and cloud infrastructure to provide real-time insights across our operational stack.
- Improve accuracy: integrate retrieval-augmented generation strategies to boost accuracy, drawing on continuous usage data and best-practice recommendations.